Showing posts with label bluemix. Show all posts

Friday, 11 December 2015

DOORS reporting to IoT

So far we had an example how to use DOORS to read IoT historian data. Now it's time to publish something back.

There's no problem sending some useless data, the problem is to make sense out if it. So let's think on some 'real World' usage.


"Would you like to know when your most favorite module was modified?" 


Why not!

This could look like this:
Someone is playing with my module!


If you read my previous posts you know we have a Tracked Resource Set (TRS) support in DOORS Web Access.
When enabled (as it's not by default) TRS "tells" us about all Modification, Creation and Deletion changes in DOORS Database.

So we need to modify a TRS reader to its new purpose.

I decided I won't need a front end for my TRS translation service so I rewrote the app.js:

/* jshint node:true */
var trs = require('./trs')
var superagent = require('superagent');
var iotf = require("ibmiotf");

//this is used to hide self-signed certificate errors
process.env.NODE_TLS_REJECT_UNAUTHORIZED = "0";

// IoTF setup
var deviceClientConfig = {
  org: 'quickstart',
  type: 'mytype',
  id: '001122334455',
  'auth-method':'token',
  'auth-token': 'secret'
};

var deviceClient = new iotf.IotfDevice(deviceClientConfig );
deviceClient.connect();
deviceClient.on("connect", function () {
 console.log("Connected to IoTF");
});

var user1 = null;
function updateTRS() {
 if (user1 == null) {
  user1 = superagent.agent();
  user1
    .post('https://DOORS_SERVER:8443/dwa/j_acegi_security_check')
    .type('form')
    .send({ j_username: 'DOORS_USER', j_password: 'PASSWORD'})
    .end(function(err, res) {
    })
 }
 else{
  trs.TRSUpdate(user1, deviceClient, function(err) {
    // just ping I'm alive
    console.log(". " +err); // one might want to check if err is defined
  });
 }
}

//query DWA for TRS changes
setInterval(updateTRS, 10*1000); //every 10 seconds
updateTRS()


Simple and quick. Now changes to trs.js which as you can see now takes additional deviceClient parameter.

Changes are really obvious:

1 . First publishing method

function publishTRS(deviceClient, data) {
   //publishing event using the user-defined quality of service
   var myQosLevel=2

   deviceClient.publish("trs_update","json",'{"d" : { "trs" : '+JSON.stringify(data)+' }}', myQosLevel);
   console.log("send data ->" + util.inspect(data));
}

2. Modified function parameters.
Note changes are no longer added to array. Instead those are send directly to IoTF

< function parseChangeLogs(clResults, client, last) {
---
> function parseChangeLogs(clResults, last) {
>     var changes = [];
97c88
< publishTRS(client, {start:dt, id:o.object, content:object, group:grp});
---
> changes.push({start:dt, id:o.object, content:object, group:grp});
108c99
< last(err);
---
> last(changes);
169c159
< exports.TRSUpdate = function(usr, client, last) {
---
> exports.TRSUpdate = function(usr, last) {
176c166
< parseChangeLogs(results, client, last);
---
> parseChangeLogs(results, last);

Now your TRS example is ready to talk to IoTF! Time to prepare IoTF application to use this feed.

Internet of Things Foundation

Go to you Bluemix dashboard and add new IoTF starter application. This will create for you a simple Node-Red application. Remember to add some credentials so only you will have access to your dashboard.

Once ready navigate to you IoTF dashboard
IoTF dashboard link

Here we will add a new device type to you IoT world.

New IoTF Device Type

Select Devices, Device Types and Create Type (on the bottom of the page)

The wizard will guide you to provide

  1. Name and description
  2. Define template
  3. Define template

Save the type and proceed to add new Device


IoTF Device

Select Devices, Create Device (again on the bottom of the page)
You will have similar wizard. If you select Type defined earlier some fields will be populated.

  1. Device ID
  2. Security
  3. Summary
    Please note credentials are NOT recoverable!

Finally Node-Red end


Once your device is ready, you can work on your Node Red consumer. 
Here I will just indicate how it might look like. I'm not going to write your business logic ;) I'm just showing an example what you can do.

So your full example would might look like:

Mine is just showing it works so you can try and do what you want.

I had to configure my IoT input:

Prepare my "business logic"

And observe the output if warning is set to true:


Conclusion

In those really simple steps we made a DOORS Web Access Tracked Resource Set a s Thing!

We just 'thingified' DOORS! 

Wednesday, 2 December 2015

DOORS 9 IoT Report

Let's think about following user story:
"As a Requirement Engineer I would like to know how many errors my devices report"

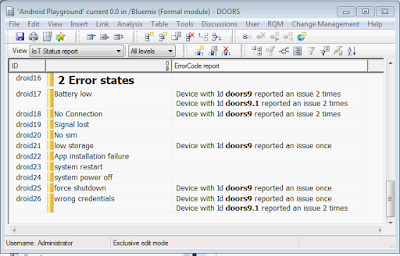
In DOORS 9 module one can visualize this as:
Example report in DOORS9

So we would like to get a number of errors of given type reported by each of devices.

Device Error Reports in Sample App

First I need a device which can send some error codes. The IoT Starter Application mentioned in one of previous post publishes three kind of messages

  • touchmove - user interaction with screen
  • accel - orientation of the device and its position
  • text - a text provided by user

I extended that application to be able to send error codes.
 

Pressing "Send Error" button and selecting error code sends a MQTT message to IoTF broker.

Typical error message looks like;
{
device_id"doors9"
evt_type"error"
timestamp:
{
$date1449059192155
}
evt: 
{
errorCode"20"
}

}

For a compiled version of this application follow this link.
Now I could start updating my module.

Design for Analytics


Requirements in my DOORS module have a "ErrorCode" integer attribute which links a requirement to a error code reported by my device.

Additionally I'm using DOORS module level attributes to store values I do not need hardcoded in my DXL. Those are:
  • Authorization (string)- so I do not need to calculate Base64 on each call
  • DeviceType 
    (string) - which of my devices this module describes
  • Organization (string) - my Bluemix organisation name
With all information in place I can write some simple layout DXL (which can be convert to attribute DXL later on to improve performance)

Layout DXL 

I want a specific type of event from all devices of a given type from my organization. So I need to use a historic query for a device type:

buf = "https://internetofthings.ibmcloud.com/api/v0001/historian/" org"/" deviceType "?evt_type=" eventId

This will return a JSON string with a list of events. If you do not have a JSON parser ready you can try to parse this data with Regular Expressions. Please remember this is a very simple example and in real world one shall not attempt to parse JSON with regular expressions.

My main worker code looks like:
if (!null obj) {
  int ival = obj."ErrorCode"
  if (ival == 0) halt
 
  string val = obj."ErrorCode"
  Module m = module obj
  string auth = m."Authorization"
  string dtype = m."DeviceType"
  string org = m."Organization"
 
  if (!null m && auth != "" && org != "" && dtype != "")
  {
    Buffer b = getData(auth, org, dtype, "error")

    if (!null b)  {
      string s = stringOf b
      Regexp re = regexp2 "\"device_id\":\"([^\"]*)\"[^}]+.[^}]+{\"errorCode\":\"([^\"]*)\""
      int i = 0
      string device = "", code =""
      //  temporary skip to hold names of devices which reported
      Skip erSkp = createString
      int allErrors = 0
      int numDevices = 0
      while (!null s && re s && i<100) {  // i is just a guard, we know there is no more then a 100 results in one page
        device = s[match 1]
        code = s[match 2]
        int ireported = 0
        // if code matches attribute value
        if (code == val)
        {
          allErrors++ // icrease number of errors
         
          if (!find(erSkp, device, ireported)) {
            put(erSkp, device, 1)
            numDevices++
          }
          else {
            ireported++
            put(erSkp, device, ireported, true)
          }
        }
        s = s[end 0 +1:]
        i++
      } // while
      // clean up
      delete b
     
      // report
      if (allErrors != 0) {
        for ireported in erSkp do {
          device = (string key erSkp)
          displayRich "Device with Id {\\b "device "} reported an issue " (ireported == 1 ? "once" : ireported" times")
        }
      }
     
      delete erSkp
    } // null b
  } // module setup
} // !null obj

You can find full DXL here.

Conclusion


Above layout DXL works fine when there're not so many devices. Once there will be more of them we no longer want to see how many times each device reported given issue. Thus the DXL could be rewritten to show something like:
Example report


As you saw in this example I'm using layout DXL but I think for a better understanding and feedback, one should consider writing a utility DXL.
Maybe that utility could provide its own UI for easier navigation?

In example above there's no need to send a HttpRequest for each object... It is enough to make one call per 100 (max page) events returned by query and write a little more complex Skip management. That however would require to make one top level Skip, but I'm sure you all know how to do it.

Monday, 30 November 2015

Displaying real-time IoT data in IBM DOORS (Doors Web Access)

There are many ways in which we could imagine surfacing IoT data in the IBM DOORS interface.

One way that I would propose is to extend the rich hover so that you could see IoT data in real-time, displayed when you hover over an IBM DOORS link-end point. Imagine being an IBM RQM user looking at a defect and being able to hover over a link to a requirement and see the history of a thing displayed.

Extending the rich hover to display IoT data in IBM DOORS Web Access


Extending the rich hover to display IBM DOORS IoT data in IBM RQM


Showing display of real-time data in hover over


As part of the technical investigation I looked into the implementation of a JavaScript client which listens for data from a device in the IoT Foundation. And then display that real-time data in the UI. The functioning graphing component is shown in the examples above. I will blog about the JavaScript / IoT implementation in a future post. 


Thursday, 19 November 2015

DOORS IoT data example

In my last post I demonstrated how easy it is to get data from IoT Foundation. But many of you might thing, why? Well I just wanted to show how easy it is to report on IoT data using pure old DOORS 9 but there was no fun in the preview post, just boring numbers. 

Example Scenario

Let's have a hypothetical example where we measure yaw/pitch/roll and have following rules:
  1. Measurable parameters of an Android Device shall not exceed expected maximum values
  2. Each report of a value exceeding 0.77 of maximum should be indicated Orange
  3. Each report of a value exceeding 0.88 of maximum should be indicated Red

So we need something to read data from IoT device, storage for a maximum value and some nice indicators.

Module Attributes

I just extended my module with extra attributes:
  • iot_data (real) - doesn't affect change bar, doesn't affect change dates and doesn't generate history
  • range_max (real) - a regular attribute of type range

Having add those I can update my layout DXL column to render color depending on current value:

if (findPlainText(re, ":", l, o, false)) {
  string ss = re[l+1:length(re) -3]
  real r = realOf ss
  obj."iot_data" = r
  real m = obj."range_max"
  real rm = r/m
  DBE cnv = getCanvas
  realBackground(cnv, realColor_Green)
  if (rm >= 0.77 && rm < 0.88) {
    realBackground(cnv, realColor_Orange)
    realColor(cnv, realColor_White)
  }
  else if (rm >= 0.88) {
    realBackground(cnv, realColor_Red)
    realColor(cnv, realColor_White)
  }
  else {
    realColor(cnv, realColor_Black)
  }
  display ss
}

Code isn't perfect, could be faster, but that's not the point here ;)

Now let's have some fun with canvas DXL. Add new DXL column and set its DXL to:

DBE canvas = getCanvas
if (canvas==null) halt

int rh = 50 du
int rw = 100 du

setHeight rh
setWidth rw

int normalize(real  x, max) {
  real  i = 180.0+ x/max * 180.0
  return intOf i
}

real x = (obj."iot_data")
real m = (obj."range_max")

if (m == 0.0) halt

int v = normalize(x, m)
int margin = 1

realColor(canvas, realColor_Green)

if (v >= 280 && v < 320) {
  realColor(canvas, realColor_Orange)
  margin = 2
}
else if (v >= 320) {
  realColor(canvas, realColor_Red)
  margin = 5
}

ellipse(canvas, 0, 0, rw, 2*rh)
realColor(canvas, realColor_White)
ellipse(canvas, margin, margin, rw-2*margin, (2*rh)-2*margin)

realColor(canvas, realColor_Black)
polarLine(canvas, rw/2, rh-1, rh, v)
Resulting View will show us (almost) real-time events and warning from our device.

DOORS 9 View with almost real-time IoT data warnings

Remember this could be a group of devices or a single device. It all depends what you want to measure.

Conclusions

IoT Foundation and DOORS 9 are really cool and really powerful! Hope to show you some more fun stuff soon!

Monday, 29 June 2015

Free books from IBM

It will be a very short post, it's my holiday afterall but I will be back shortly ;)

IBM Redbooks are available for Google Play or iTunes Store. Most of them, if not all, are free!
Have a look at Cloud Computing Patterns of Expertise for many useful tips on cloud application development. Ideal for a quick summer read ;)